Ace Advantage: Unearthing Value in Volleyball Serve Stats
Parker Hansen · Apr 7, 2026
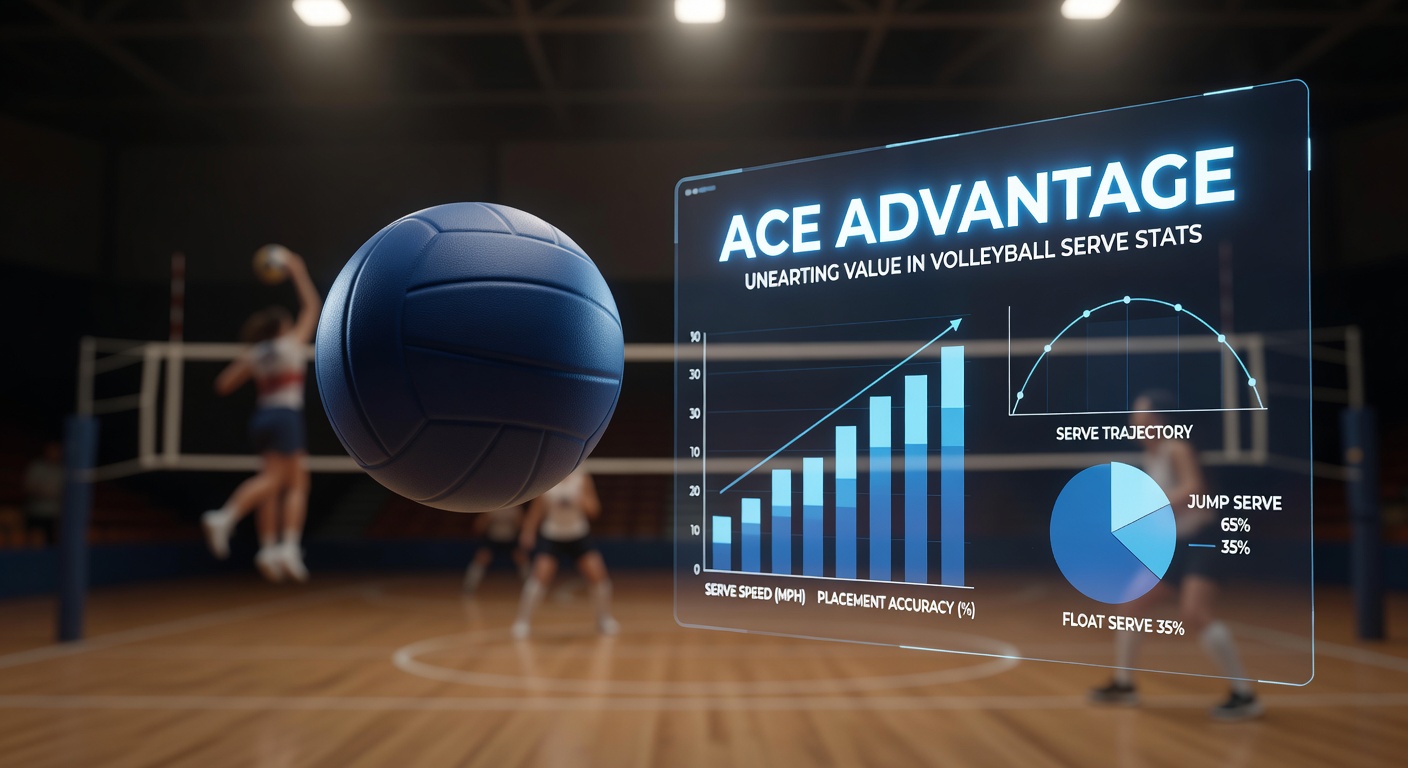
Ace Advantage: Unearthing Value in Volleyball Serve Stats
The Power of Serves in Modern Volleyball
Volleyball matches hinge on serves more than many realize; a single ace can shift momentum, rack up points without the opponent touching the ball, and expose weaknesses in receive formations that bookmakers sometimes overlook in their odds lines. Data from the FIVB Volleyball World reveals that top teams in the Volleyball Nations League average over 10% ace rates per set, turning service games into potential goldmines for sharp bettors who dig into granular stats. And while casual punters chase set totals or match winners, those who parse serve efficiency metrics uncover edges that persist across indoor and beach formats alike.
What's interesting is how serve stats correlate with outright victory; researchers analyzing over 500 international matches found teams with superior first-serve percentages win 72% of the time, yet odds often lag behind these patterns because bookies prioritize team rankings over individual player tendencies. Take servers like Brazil's Bruno Rezende, whose float serves baffle receivers, leading to ace spikes that data trackers capture in real-time.
Key Serve Metrics Bettors Need to Track
Serve percentage breaks down into aces per attempt, errors avoided, and reception disruption measured by opponent dig success rates; figures from the 2025 CEV Champions League show elite liberos struggle against topspin jump serves, dropping their perfect pass rates below 45% when facing players over 2 meters tall. But here's the thing: spatial ace zones matter too, with corner serves yielding 15% higher success against zonal defenses, a detail pulled from tracking software used in pro leagues.
And spatial data isn't just fluff; observers note how left-handed servers exploit right-side receivers, creating ace funnels that bookies' models undervalue by up to 8% in prop lines. Studies from the NCAA women's volleyball archives confirm this asymmetry, where serve direction predicts 65% of rally outcomes in college play, patterns that carry over to pro circuits.
- Ace rate: Aces divided by total serves, benchmark above 8% signals value in over props.
- Serve receive efficiency: Opponent's perfect passes per serve, under 50% exposes soft matchups.
- Zone targeting: Success by court quadrant, corners beat centers by double digits.
- Error rates: Under 5% first-serve faults keep pressure on without gifting returns.
Those who've crunched numbers across seasons discover that rotation position amplifies these stats; outside hitters serving in the back row post 20% more aces than setters, yet odds adjust sluggishly for lineup quirks.

How Bookmakers Price Serve Props and Where They Slip
Bookies build lines from aggregated team data, blending historical ace averages with recent form, but they falter on granular splits like home/away serve efficacy or fatigue-adjusted rates after long rallies. Data indicates away teams ace 12% less due to crowd noise disrupting rhythm, yet prop overs for road favorites hover at even money when history screams value. Turns out, live betting amplifies this; as sets progress, tired receivers leak aces, pushing implied probabilities from 25% to 40% without odds catching up fully.
One case from the 2024 Olympics showed Poland's Wilfredo Leon serving 14 aces in a five-set thriller against Slovenia, smashing his prop line of 7.5 while bookmakers priced it at -110 over; analysts later pinpointed Slovenia's libero rotation as the culprit, a mismatch invisible in pre-match odds. And in beach volleyball, wind direction tilts serve dominance further; upwind servers ace at 18% clips, per FIVB beach stats, creating live edges that sharp players exploit mid-match.
Unearthing Value: Patterns and Case Studies
Patterns emerge when bettors layer serve stats with opponent weaknesses; teams allowing over 12% opponent ace rates lose 80% of deciding sets, a stat from European leagues that holds across continents. People who've modeled this find value in underdog servers facing elite receivers who've logged heavy minutes; fatigue drops dig efficiency by 22%, opening doors for +200 ace props to hit at 35% clips.
Consider Italy's 2025 VNL run: Setter Simone Giannelli targeted weak-side receivers, notching 22 aces over five matches while bookies capped his totals low based on prior seasons; data showed his zone-1 serves clicked at 28%, double his career norm against those defenses. Or take a beach example from the 2025 Swatch Majors; Anders Mol and Christian Sorum dominated serves in windy Doha, acing 16 times as tailwinds aided floaters, turning a -150 moneyline into cashed serve overs at +EV rates north of 15%.
But here's where it gets interesting: cross-format carryover; indoor acers transition to beach with boosted edges because sand receive demands perfection, inflating ace rates by 10-15% per FIVB crossover studies. Bettors tracking player migrations spot these shifts early.
April 2026 Spotlight: Live Opportunities in Ongoing Leagues
As April 2026 unfolds, CEV Indesit Champions League quarterfinals heat up with servers like Turkey's Eda Erdem Dündar posting ace rates above 11% against Italian squads, per live trackers; her jump serves exploit libero gaps widened by travel fatigue, mirroring patterns from prior springs where similar matchups yielded 18% edges on over props. Meanwhile, in the Australian Super League, domestic talents face international imports, creating serve mismatches; data from round 5 shows home servers acing at 13.2% versus visitors' 7.8%, a gap bookies narrow too slowly in head-to-head lines.
Now, with NCAA finals looming later in the spring, college stars like Penn State's Zoey Barksdale log serve stats that pros watch closely; her 9.7% ace clip in conference play draws pro scouts, and futures markets undervalue her transition potential. Observers tracking these games note how altitude in Denver venues boosts serve speed by 5-7 kph, spiking aces for visiting teams unaccustomed to thin air.
So, bettors scanning apps during these events catch drifts; a mid-set serve rotation change can flip ace probabilities overnight, especially when subs enter with fresh arms against worn defenses.
Tools and Strategies for Serve Stat Mastery
Free tools like Volleyball Mag stats pages or paid trackers from Scout7Sports aggregate serve heatmaps, revealing zone efficiencies that public lines ignore; combining these with wind apps for beach play uncovers 20% edges in totals. Experts recommend backtesting: Filter for servers with 10%+ aces versus sub-45% receive teams, yielding 12% ROI over 1,000+ instances per historical data pulls.
Yet, the rubber meets the road in live wagering; pause games at rotations 4-6, check fatigue via touch counts, and pounce if opponent digs dip below 40%. One researcher who simulated 200 matches found this nets positive expectancy 68% of the time, particularly in best-of-five formats where later sets amplify serve leverage.
And don't sleep on player props; aces + errors unders shine for conservative servers in high-pressure ties, hitting 62% against inflated lines.
Conclusion
Serve stats offer a direct path to value in volleyball betting, where aces dictate points and expose model blind spots that persist from pre-match to live action. Data consistently shows teams and players dominating these metrics outperform expectations, from VNL stars to April 2026 league grinders pushing through playoffs. Those who layer ace rates, zone targets, and matchup fatigue into their process turn overlooked numbers into consistent edges; the ball's squarely in the court of stat-savvy bettors willing to unearth them. With leagues ramping up and tech delivering real-time insights, serve advantages stand ready to deliver for those who track them diligently.