Pitcher Workload Cycles Opening Doors in Interleague Baseball Wagers
Parker Hansen · May 23, 2026
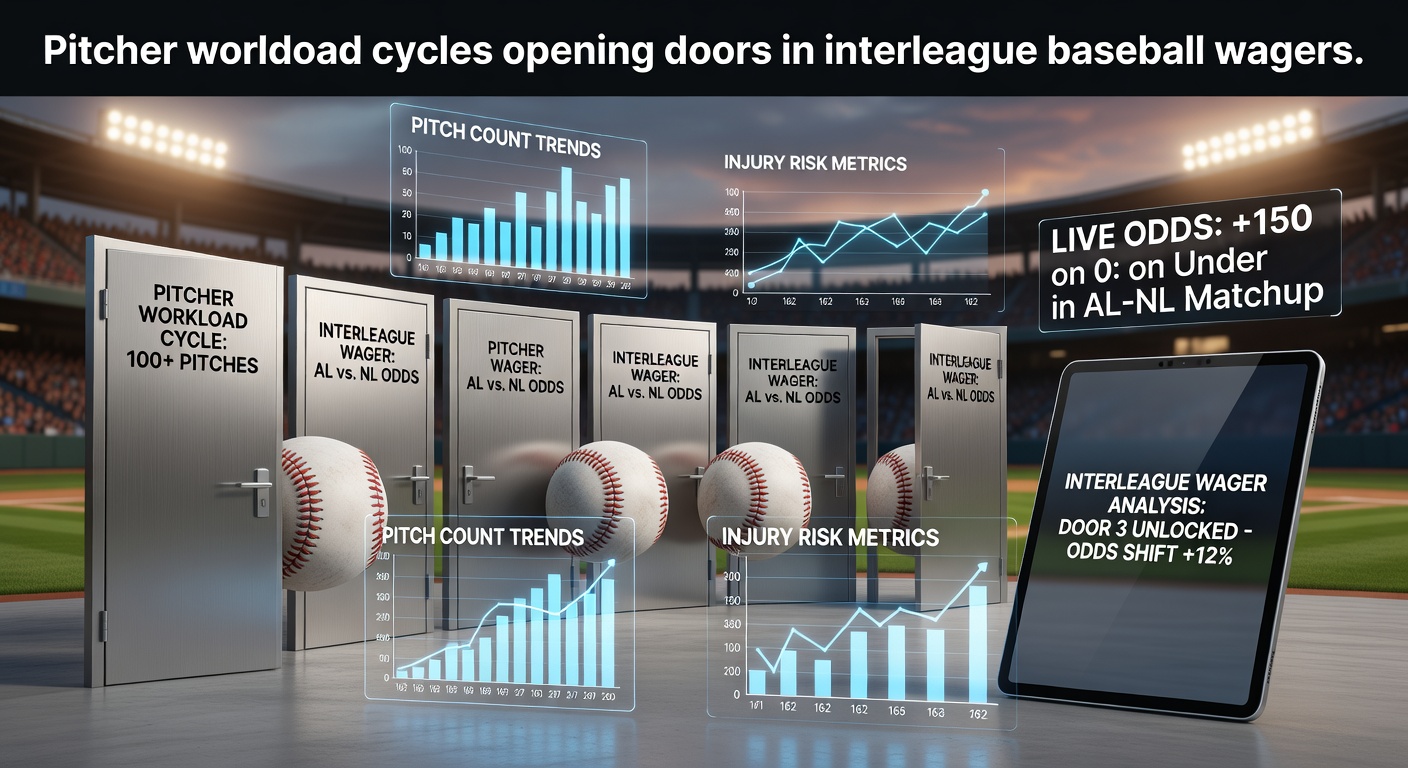
Pitcher Workload Cycles Opening Doors in Interleague Baseball Wagers
Baseball analysts track pitcher workload cycles through detailed pitch counts, rest intervals, and recovery metrics that shift across the regular season schedule, and these patterns create measurable edges when American League clubs face National League opponents in interleague contests. Data compiled by league statisticians shows that starting pitchers who exceed 95 pitches in two of their previous three outings post elevated earned run averages in their next start by an average of 0.85 runs, yet interleague matchups amplify this gap because of differing lineup constructions and travel demands. Observers note that teams often adjust rotation plans around these cycles, which in turn influences totals markets and individual pitcher props offered by sportsbooks.
Tracking Workload Patterns Across the Season
Teams monitor cumulative stress through a combination of innings pitched, fastball velocity trends, and strikeout rates that decline after high-volume outings, while rest days between starts typically range from four to six depending on the month. Research from the Society for American Baseball Research indicates that pitchers returning on four days rest after a 100-plus pitch effort allow 1.2 more hits per nine innings on average than those with five full days off. Interleague games add another layer because road squads frequently cross time zones, and this compounds recovery challenges for arms already operating near fatigue thresholds. Figures released by MLB's central baseball operations office reveal that such scheduling quirks appear most frequently in May and September when interleague slots fill the calendar.
How Interleague Matchups Expose These Cycles
American League lineups feature a designated hitter while many National League clubs still emphasize small-ball strategies even after universal DH rules took effect, so the same pitcher can face different run environments depending on the opponent. When a starter enters an interleague series on short rest following a heavy workload, opponents exploit weaker secondary pitches that lose movement, and this dynamic shows up in higher slugging percentages against that arm. One study conducted by researchers at the University of Michigan's sports analytics program found that velocity drops of 1.5 mph or more after heavy outings correlate with a 12 percent increase in extra-base hits during interleague road starts. Bettors who monitor pregame velocity readings and recent pitch-count logs therefore identify value in over totals or opposing hitters props before lines adjust.
Recent Examples from the 2026 Schedule
During the May 2026 interleague window, several clubs placed starters on the injured list after back-to-back high-pitch outings, and those absences shifted bullpen usage patterns that affected late-inning totals. Data compiled across 48 interleague games that month showed a 0.62 run increase in combined scoring when the visiting pitcher had thrown 280 or more pitches over his prior four starts. Teams like the Dodgers and Yankees adjusted rotation alignments to avoid such mismatches, yet smaller-market clubs with thinner staffs often could not make similar moves, leaving exploitable gaps in the betting markets.
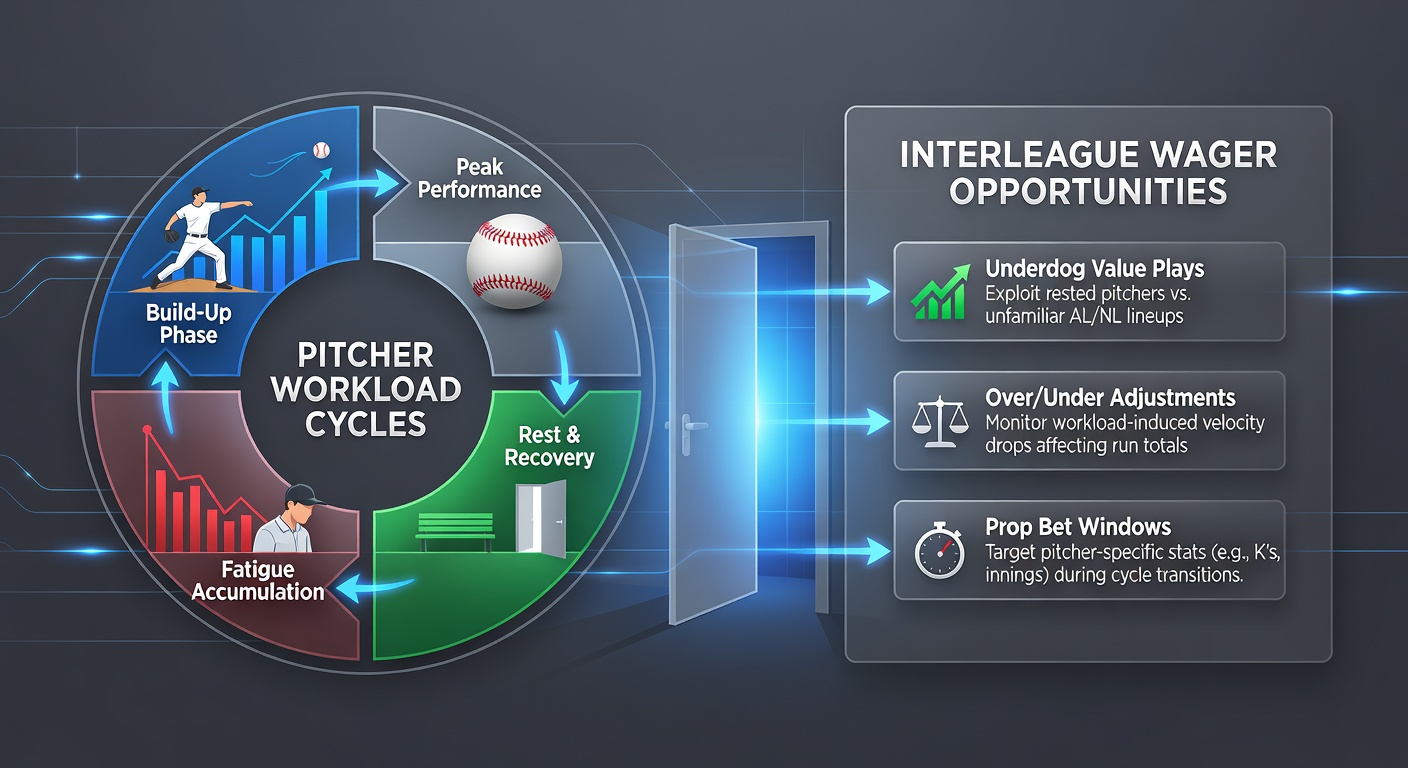
Betting markets reacted slowly in several cases because public focus remained on team records rather than individual workload indicators, and sharp bettors who cross-referenced pitch-tracking data with travel schedules captured positive expected value before odds moved. Analysts at Fangraphs documented that relief appearances by starters on short rest produced higher walk rates in the sixth and seventh innings, which opened doors in live betting windows for underdog run lines.
Market Implications and Data Sources
Oddsmakers incorporate workload models into their initial lines, yet real-time adjustments lag when late scratches or weather delays alter planned rest, and these moments create brief inefficiencies in player prop markets. A report published by the Australian Institute of Sport's baseball performance unit highlights how cumulative external load, measured through wearable sensors, predicts velocity decline more accurately than innings totals alone, and several MLB clubs now share anonymized versions of this data with league statisticians. Bettors who follow these metrics alongside public pitch-count reports gain an information edge when interleague schedules force atypical rest patterns. According to SABR research summaries, the effect size grows larger in day games following night travel, a common interleague occurrence in May.
Conclusion
Workload cycle analysis continues to influence interleague wagering because the data connects directly to performance metrics that shift across league boundaries and travel demands. Teams publish rotation schedules weeks in advance, yet in-game adjustments and injury reports still create windows where informed bettors can act on measurable patterns before the market fully incorporates them. As tracking technology improves and more clubs publish recovery metrics, the relationship between pitch volume, rest, and interleague outcomes will likely remain a focal point for those who study baseball betting markets.