Seasonal Variance Patterns in Goal Distributions Across Lower-Tier European Leagues
Xander Ludwig · Jun 30, 2026
Seasonal Variance Patterns in Goal Distributions Across Lower-Tier European Leagues
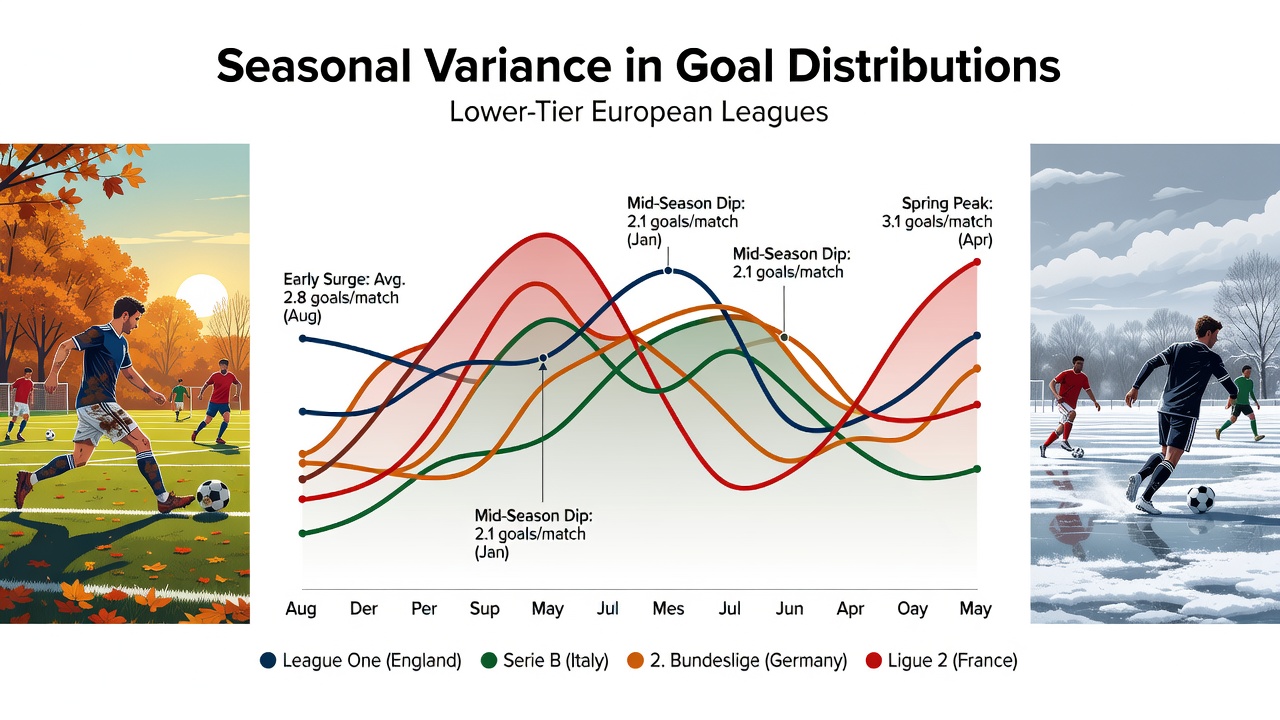
Lower-tier European leagues display distinct seasonal shifts in goal distributions that researchers have tracked across multiple campaigns, and these patterns emerge from factors including weather conditions, fixture density, and squad management decisions that vary by month. Data compiled from England’s League One and League Two, Germany’s 2. Bundesliga, Italy’s Serie B, and Spain’s Segunda División reveal consistent monthly fluctuations where average goals per match rise noticeably from February onward while showing dips during the coldest winter periods.
Winter Months and Reduced Scoring
December through February often produces the lowest goal tallies in northern European competitions because pitches harden or become waterlogged, and teams adopt more cautious approaches to avoid injuries. Figures from the 2. Bundesliga indicate that matches played in January average 2.61 goals compared with 2.94 goals in the same fixtures during April, a difference that holds across five consecutive seasons ending in 2025. Observers note that travel disruptions and shorter recovery windows between games further suppress attacking output in these months, particularly in leagues where clubs operate with smaller squads and limited rotation options.
Spring Surge and End-of-Season Dynamics
Goal rates climb steadily from March through May as temperatures stabilize and pitches improve, allowing wider play and more open contests. In League One, data collected between 2020 and 2025 shows an increase from 2.48 goals per game in February to 3.12 goals per game in April, driven partly by teams with nothing left to play for adopting looser defensive structures. Those patterns repeat in Segunda División where promoted or relegated sides contribute higher scoring outputs once mathematical outcomes are decided. Analysts tracking these trends find that the variance widens as well, with a greater spread between high-scoring and low-scoring matches appearing in the final eight weeks of each campaign.
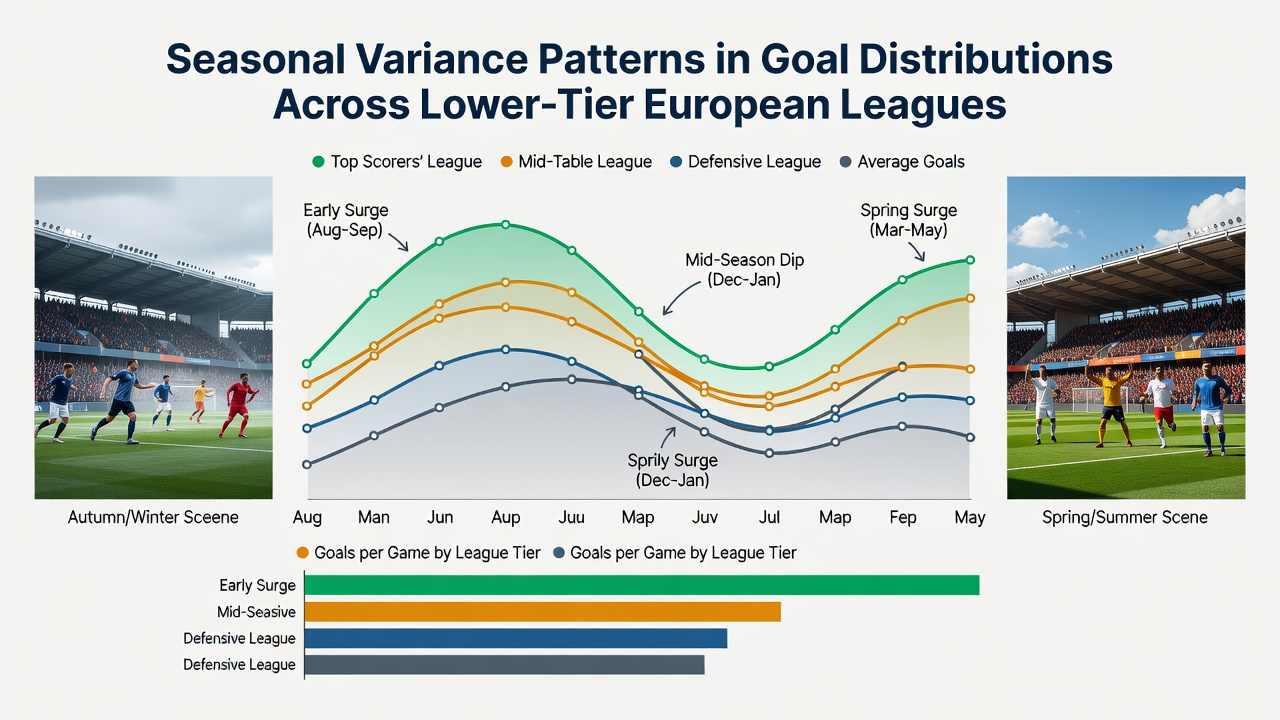
Fixture congestion during March and April, when cup competitions overlap with league schedules, creates additional variance because managers rest key attackers or experiment with formations. This period coincides with international breaks that remove players from lower-league clubs, forcing tactical adjustments that sometimes elevate goal numbers when replacements lack defensive cohesion. Research published through the CIES Football Observatory highlights how these interruptions affect match tempo differently across leagues, with Serie B showing sharper spikes in goals after breaks than its English counterparts.
Regional Differences in Seasonal Impact
Southern European leagues exhibit milder winter dips yet still register clear spring increases tied to motivational shifts rather than weather alone. In Segunda División, goal averages remain above 2.70 throughout winter before climbing above 3.00 in May, whereas 2. Bundesliga records more pronounced swings of up to 0.5 goals per match between January and April. Italian Serie B data reveals that matches involving mid-table sides produce steadier distributions year-round, while promotion and relegation battles generate the largest monthly deviations. These regional contrasts stem from differences in climate resilience, pitch maintenance standards, and financial resources available for squad depth.
Statistical models applied to historical results demonstrate that variance peaks during the final month of the regular season because outcome uncertainty decreases for some clubs while intensifying for others. June 2026 will mark the conclusion of the 2025-26 campaigns in several leagues, and preliminary tracking through play-off rounds already suggests continued elevation in goal rates during decisive matches. External sources such as reports from the European Club Association document how end-of-season financial pressures influence playing styles, often resulting in more open games when survival or promotion bonuses are at stake.
Factors Driving Monthly Fluctuations
Pitch quality, refereeing consistency, and player fatigue accumulate across the winter period and then ease in spring, producing measurable changes in shot volume and conversion rates. Lower-tier clubs rarely possess advanced recovery facilities, so accumulated fatigue manifests in defensive lapses that increase goals after the turn of the year. Studies from academic institutions in Spain and Germany confirm that temperature thresholds below five degrees Celsius correlate with reduced high-intensity running and fewer shots on target, directly affecting distributions in northern leagues. Meanwhile, fixture lists that bunch games around holiday periods create short-term spikes or troughs depending on rest allocation.
Promoted teams entering lower-tier divisions from amateur levels sometimes distort early-season averages because they adjust to professional intensity over several months, and this adjustment phase contributes to higher variance in August through October. Conversely, teams fighting relegation late in the campaign tighten defensively until safety is secured, after which attacking freedom returns and goal numbers rise again. These cycles repeat reliably enough that pattern recognition appears in aggregated datasets spanning more than a decade.
Conclusion
Seasonal variance in goal distributions across lower-tier European leagues follows repeatable monthly trajectories shaped by environmental conditions, scheduling density, and competitive stakes. Data from multiple countries illustrate how winter constraints give way to spring expansions in scoring, with regional differences reflecting climate and resource variations. As the 2025-26 season heads toward its June 2026 conclusion, ongoing collection of match statistics will continue to refine understanding of these recurring patterns without requiring subjective interpretation.