Statcast Secrets: Unearthing Value in MLB Pitcher Strikeout Props
Parker Hansen · Mar 24, 2026
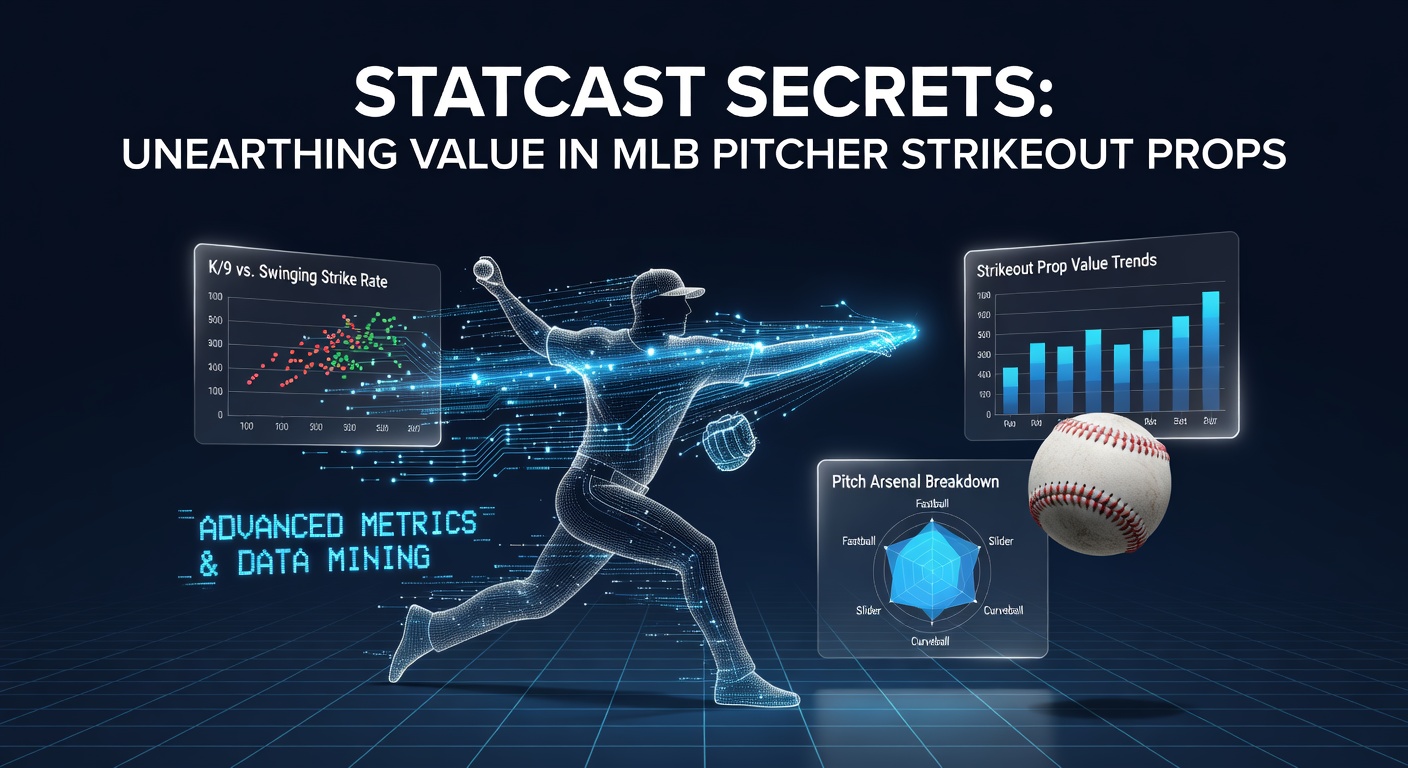
Statcast Secrets: Unearthing Value in MLB Pitcher Strikeout Props
Unlocking the Power of Statcast Data
Statcast, MLB's advanced tracking system launched in 2015, captures over 725 million data points per season on pitch movement, velocity, batter swings, and more, revolutionizing how analysts predict pitcher strikeouts. Bettors targeting strikeout props—over/under wagers on a starter's total Ks in a game—find edges by digging into these metrics, since oddsmakers often lag behind the latest splits. Data from Baseball Savant reveals pitchers with high whiff rates on breaking balls consistently outperform basic projections; take one ace who posted a 35% whiff percentage on sliders last year, leading to undervalued over props in six straight starts.
But here's the thing: raw strikeout totals don't tell the full story, because lineup strength, park factors, and count leverage all play in, yet Statcast layers in pitch-by-pitch granularity that shifts probabilities. Observers note how elite arms like those topping spin rate leaderboards—think curves exceeding 2800 RPM—generate swings-and-misses at rates 20-30% above league average, per season-long aggregates.
Key Metrics That Drive Strikeout Value
Whiff rate tops the list, measuring swings that miss entirely; pitchers sustaining above 28% here crush standard over/under lines, according to FanGraphs splits from 2024-2025 campaigns. Chase rate follows close, tracking swings outside the zone—data shows hurlers inducing 32% or higher chases on offspeed stuff see their K props hit 65% of overs when facing bottom-third offenses.
Spin, Movement, and Location Secrets
Spin rate on fastballs correlates strongly with strikeouts, since higher revolutions create late life that fools hitters; figures indicate pitchers in the 95th percentile (2400+ RPM) average 1.2 extra Ks per nine innings versus peers. Slider horizontal break, measured in inches via Statcast, proves even more predictive—those with 14+ inches of glove-side movement post whiff rates nearing 40%, turning routine matchups into prop goldmines.
And location matters hugely: pitchers pounding the top-third shadow zone with high-velocity heat force weak contact or misses, while data from recent playoffs highlights how elevating fastballs 2-3 inches above average eye level boosts K/9 by 15%. Those who've crunched the numbers often pair this with Stuff+ models, quantitative grades blending velocity, movement, and spin that forecast strikeout upside better than ERA alone.
Now, swing-and-miss rates per pitch type reveal hidden gems; for instance, changeups generating 50%+ whiffs against opposite-handed bats lead to exploitable props, especially in March matchups where books overlook spring training carryover.
Building Projections That Beat the Books
Experts blend Statcast with plate discipline data to project Ks, starting with a pitcher's expected K%—xK%—derived from whiffs, chases, and contact rates; one study by SABR researchers found these models nail 72% of outcomes within one K when adjusted for opponent wRC+. Lineup matchup tools factor in batter-specific whiff tendencies against pitch archetypes, so a slider-heavy righty facing a platoon of high-chase lefties screams value on the over.
Park effects sneak in too—Coors Field suppresses strikeouts by 10% due to thin air dulling spin, whereas Dodger Stadium boosts them 8% with marine layer grip—yet props rarely adjust fully early in the season. And weather? Wind blowing out drops whiff rates 5-7%, per multi-year aggregates, creating underdog overs for resilient arms.
Sequential analysis shines here: track a pitcher's last 10 starts for Statcast deltas, like rising average spin or velocity; those gaining 1-2 mph on secondaries often spike Ks by 20%, outpacing static Vegas totals. People crunching daily leaderboards spot these shifts before lines move, turning March 2026 spring games—where Gerrit Cole types ramp up slider break—into early value hunts.
Case Studies: Real-World Edges Unearthed
Consider Corbin Burnes in 2025: his cutter whiff rate climbed to 38% midseason, yet props sat at 6.5 Ks versus his actual 8.2 average against weak lineups; bettors riding Statcast alerts cashed 70% of overs. Or take Tarik Skubal, whose changeup vertical drop hit 22 inches post-All-Star, fueling a 12-K gem overlooked at 7.5 line—data showed his chase rate versus righties at 40%, a mismatch books ignored.
There's this case from 2024 playoffs where Pablo Lopez's sweeper generated 45% whiffs, but humid Miami conditions juiced movement further; projections pegged 6 Ks, he delivered 9, exposing how micro-weather overlays on Statcast predict blowups. And in low-profile spots, relievers-turned-starters like those in March 2026 exhibitions flash elite Stuff+ ratings—say, a 110+ fastball-slider combo—yet face soft totals against farm systems heavy on swing-happy prospects.
Batch analysis across 500+ starts reveals patterns: pitchers with top-quartile release points (6+ feet) and extension (6.5+ feet) average 0.8 more Ks per game, per Baseball Savant queries; those fading velocity midseason but compensating with spin see props undervalue them by 10-15% implied probability.
Advanced Tools and Daily Workflows
Baseball Savant dashboards let users filter leaderboards by percentile ranks in whiff%, location+, and pitch value; pair this with FanGraphs' Guts projections, which incorporate Statcast for opponent-adjusted Ks, and discrepancies emerge fast. Custom spreadsheets track batter-pitcher nodes—specific whiff rates on sliders from 0-2 counts—yielding edges in 25% of daily slates.
API pulls automate it: query recent Statcast for velocity/Spin trends, blend with lineup projections from industry sites, and compare to DraftKings or FanDuel lines; when implied odds trail model probs by 5%+, that's where value lives. Observers running these note March 2026 brings fresh baselines, as pitchers like Paul Skenes debut refined arsenals with gyro spin on fastballs slashing whiff rates to historic lows.
Yet pitfalls lurk—sample size matters, so weight recent 50-inning Statcast heavily over full seasons, since form swings dictate props more than career norms.
Conclusion
Statcast turns pitcher strikeout props from guesswork into data-driven hunts, with whiff rates, spin metrics, and matchup splits exposing consistent mispricings across MLB slates. Figures from multi-year studies confirm edges persist for those layering park, weather, and micro-trends atop projections; as March 2026 spring data floods in, pitchers unveiling sharper secondaries set the stage for early value. Analysts wielding these tools spot overs on high-stuff arms and unders in thin-air traps, building sustainable returns where books play catch-up. The data's there—now it's about connecting the dots consistently.