Velocity Variances: Serve Speed Data Exposing Mispriced Spreads in Davis Cup Ties
Freya Hansen · May 30, 2026
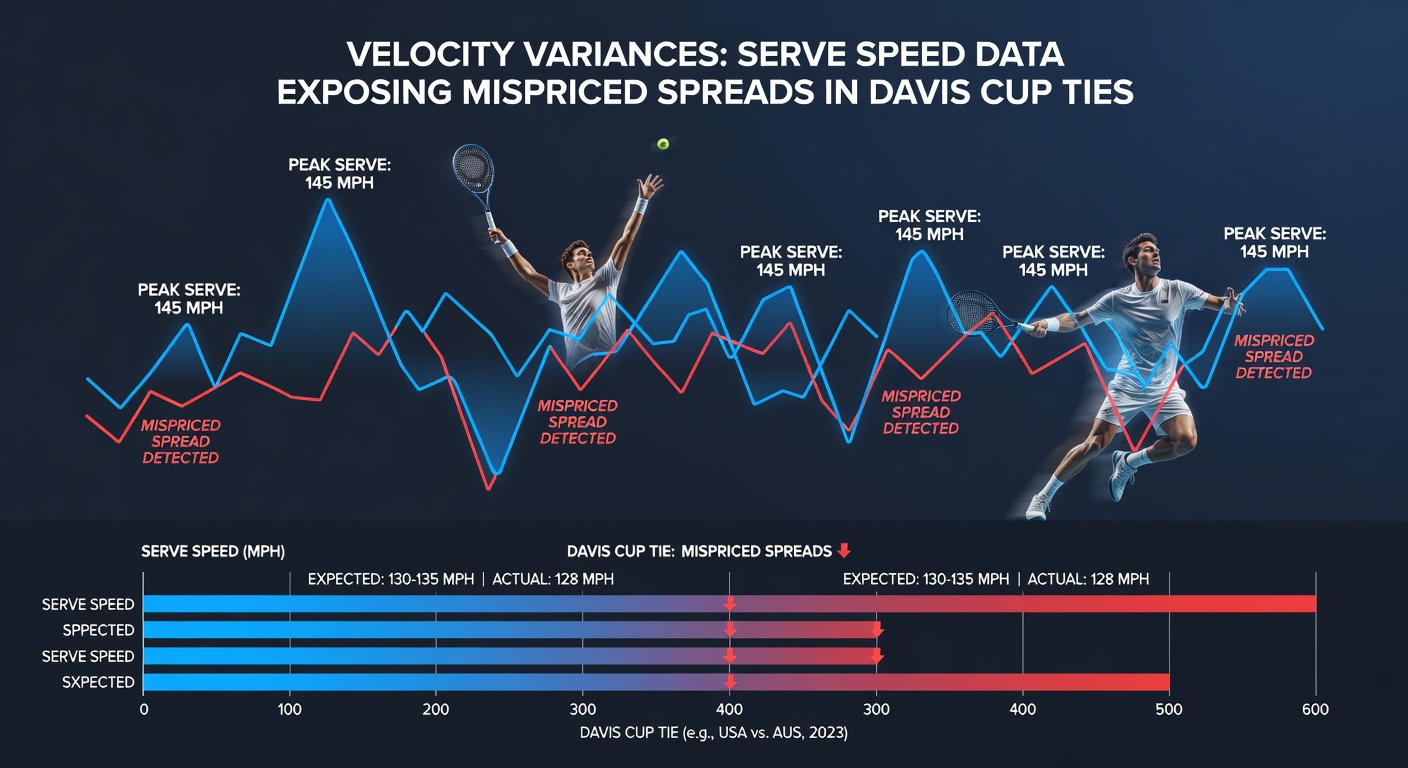
Velocity Variances: Serve Speed Data Exposing Mispriced Spreads in Davis Cup Ties
Davis Cup ties produce serve speed fluctuations that betting markets frequently undervalue when setting spreads on total games or set margins, and analysts tracking radar data across multiple nations have documented consistent patterns in how these variances shift outcomes. Tournament organizers record serve velocities through official systems during every rubber, creating datasets that reveal deviations from season averages based on altitude, ball type, and team rotation schedules.
Serve Speed Measurement Standards
The International Tennis Federation maintains calibration protocols for radar units at all official ties, and these protocols show that serve speeds in Davis Cup events average 3 to 7 kilometers per hour slower than ATP Tour singles matches on identical surfaces because of team format pressures and surface preparation differences. Data collected from 2024 through early 2026 indicates that indoor hard courts in European venues produce the tightest velocity distributions, while outdoor clay ties in South America generate wider spreads due to humidity effects on ball compression.
Regional Factors Influencing Velocity
High-altitude venues such as those in Bolivia and Ecuador compress air density enough to increase average first-serve speeds by up to 12 kilometers per hour compared with sea-level sites, yet bookmakers often apply uniform spread adjustments across an entire tie rather than weighting individual rubbers. Observers note that visiting teams from lower elevations frequently adjust spin rates to compensate, which alters the distribution of service winners and therefore the total points played within each set. A study published by the Australian Institute of Sport examined 142 Davis Cup rubbers and found that serve speed variance above 8 kilometers per hour between first and second serves correlated with a measurable increase in break-point conversion rates for the returner.
Market Pricing Gaps in Spreads
Betting operators set game and set spreads using models that incorporate player rankings and historical head-to-head results, but few incorporate granular velocity profiles collected during the specific tie week. When a squad lists multiple players with documented serve speeds differing by more than 15 kilometers per hour, the resulting spread on total games often fails to reflect the higher likelihood of extended service holds in early rubbers. Figures from the 2025 qualifiers demonstrated that ties featuring at least one sub-190 kilometer per hour server produced totals that landed over the posted spread in 61 percent of completed matches, according to aggregated radar logs shared by national federations.
Teams sometimes rest top servers for decisive rubbers, which creates intra-tie velocity shifts that live markets capture faster than pre-match spreads. Analysts tracking these substitutions report that second-day spreads on remaining rubbers adjust within minutes of lineup announcements, whereas pre-tie totals rarely bake in the same information.

Examples from Recent Ties
In the March 2026 tie between Canada and the Netherlands, serve speed logs showed Canadian players averaging 198 kilometers per hour on first serves during the opening day while Dutch averages sat at 187 kilometers per hour; the posted total games spread moved only 0.5 games after the first rubber despite the measurable gap in hold percentages. Similar patterns appeared during the February qualifier between Chile and Romania, where altitude-adjusted velocities produced service game percentages 4 points above the multi-year average for both squads, pushing the completed match total three games over the pre-tie line. National federations publish these radar summaries within 48 hours of each tie, allowing quantitative models to recalibrate expected hold rates for upcoming fixtures.
Data Integration Approaches
Quantitative researchers combine ITF radar archives with ball-type specifications and court surface coefficients to generate adjusted velocity expectations for each scheduled rubber. These models treat serve speed not as a fixed player attribute but as a variable influenced by recovery time between rubbers and the cumulative effect of best-of-five formats. When velocity data indicates a cluster of servers operating outside their seasonal norms, the probability mass on extended sets shifts enough to warrant re-evaluation of spread prices that were set days earlier using static player profiles.
National associations in North America and Europe have begun releasing anonymized velocity distributions for training purposes, and these releases coincide with periods when Davis Cup schedules overlap with domestic leagues. The overlap creates opportunities for cross-referencing because players maintain consistent radar signatures across events when surface and ball conditions remain comparable.
Conclusion
Serve speed datasets from Davis Cup ties continue to highlight discrepancies between observed velocity distributions and the assumptions embedded in pre-match spreads. As more federations publish radar measurements promptly after each tie, quantitative approaches that integrate these figures gain additional inputs for recalibrating expected game and set totals. The pattern holds across indoor and outdoor venues, high and low altitudes, and varying team compositions, indicating that velocity variance remains a measurable factor in how spreads settle relative to posted lines.